Previously in the Data series, I touched on how to think about data and how to work with both tabular data (spreadsheets) and relational data (databases). Additionally, I’ve written about designing a data system for phages, how to think about keeping track of phages in terms of core identifying characteristics and conditional and mutable characteristics, how to organize biobank data in terms of lab activities, and on data analytics vs. biology. The goal was to establish a baseline of posts I can point to, when I start writing about data engineering and biology.
Biology can be either improvisational or structured
While data for industries like banks and passport offices are (relatively) well-defined, this isn’t the case for biology. This isn’t really fault of the biology field though, as biology work itself is more exploratory, fluid, and improvisational. Well-structured data work for most industries because the work of filling out passports, sending money, and buying stuff in stores or online has become routine, well-defined, and well, boring. We don’t allow these types of work to be creative and improvisational.
Contrast this with the work of doing experiments, which is mainly one of discovery. Discovery, much like play, requires (to a degree) spontaneity, improvisation, and even unpredictability. Because of the inherent variability in biology, sometimes time points get missed, or sometimes you run into unexpected results. Exploratory work don’t always lend itself to rigid, pre-defined ways of collect data like forms or relational databases.
Of course, there’s an aspect of biology work that does look like banking, and that’s (bio-)manufacturing and production. While research* work needs to be improvisational, manufacturing needs to be routine, and well-defined.
They’re two vastly different use cases, but our data systems need to support both.
The user experience of collecting experimental data
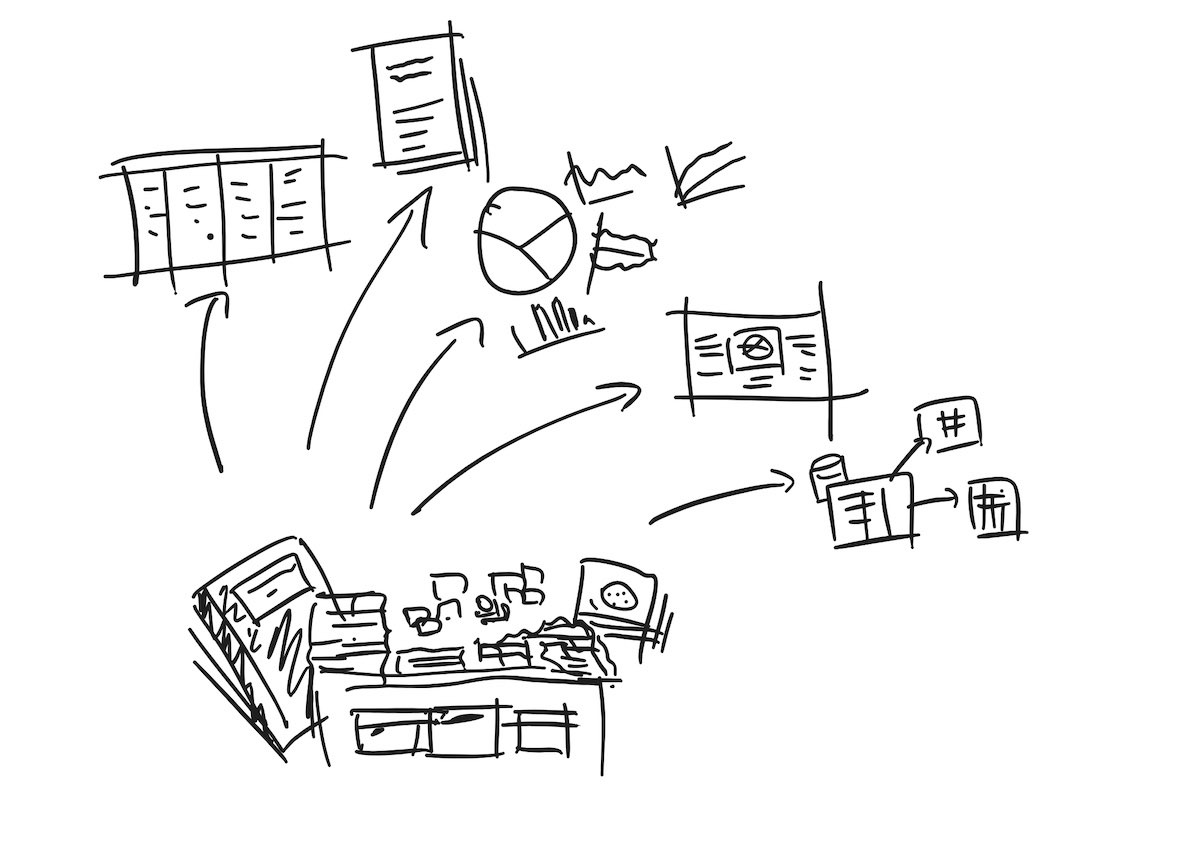
Fig 1. Usually, one has to dig into lab notes, photos, emails, and various pieces of paper and post-it notes to get the kind of data that can be used in spreadsheets, graphs, journal articles, posters, and databases.
As most readers know, most raw biology data looks like written text on paper, from lab notebooks to convenient slips of paper. Sometimes it could look like photos (e.g. plates, gels) or images (generated graphs and charts), and other times like generated to semi-structured data, ranging from images to graphs to CSVs, text logs and other formats like FASTQ files.
Often, raw data from biology needs to go through cleaning and processing to be easily analyzable: notebooks need to be transcribed, plaques need to be counted from photos. All this data needs to be recorded into tables and spreadsheets and databases for filters and formulas and graphing tools to work properly.
Neither spreadsheets nor databases are able to fully store this diverse dataset (in either its raw or processed form). Trying to store the raw data in either spreadsheets or databases will cause some sort of loss, since neither tool are able to support the full breadth of data types. Spreadsheets can’t support images, and databases don’t easily support tabular data. Google Drive supports many forms of data, but doesn’t help with data extraction and analysis, and so on. And trying to spread the data across systems creates a mess.
Spreadsheets or databases also make it difficult to easily and serendipitously record thoughts, observations, images and tabular data (like plaque counts), like paper notebooks. Notion or Apple Notes come close, but still require a lot of friction and context switching, especially between the bench and iPad or computer. These tools also don’t extract observations neatly into spreadsheets and databases, and using the table or database features can be slow and frustrating. By the time you’ve created proper Notion table to track experiment results, you’ve already lost your train of thought.
Electronic Lab Notebooks (ELNs) like Benchling attempt to impose some structure by adding layers of constraints during data entry. Though this helps with structuring and analyzing data later, there’s a tradeoff of removing the serendipity of writing down unplanned thought or observations. Experiments don’t always go as planned: sometimes you run into snags; other times you run into those “that’s odd…” moments that require further work. In these scenarios, the imposed structure of ELNs will feel like handcuffs.
So how can we collect experiment data serendipitously, while making the data analyzable, graph-able and searchable by a computer? All without having to hunt scraps of information across scribbles, emails, photos and lab notes, or having to transcribe the data into spreadsheets and databases?
Collecting data through bite-sized protocols
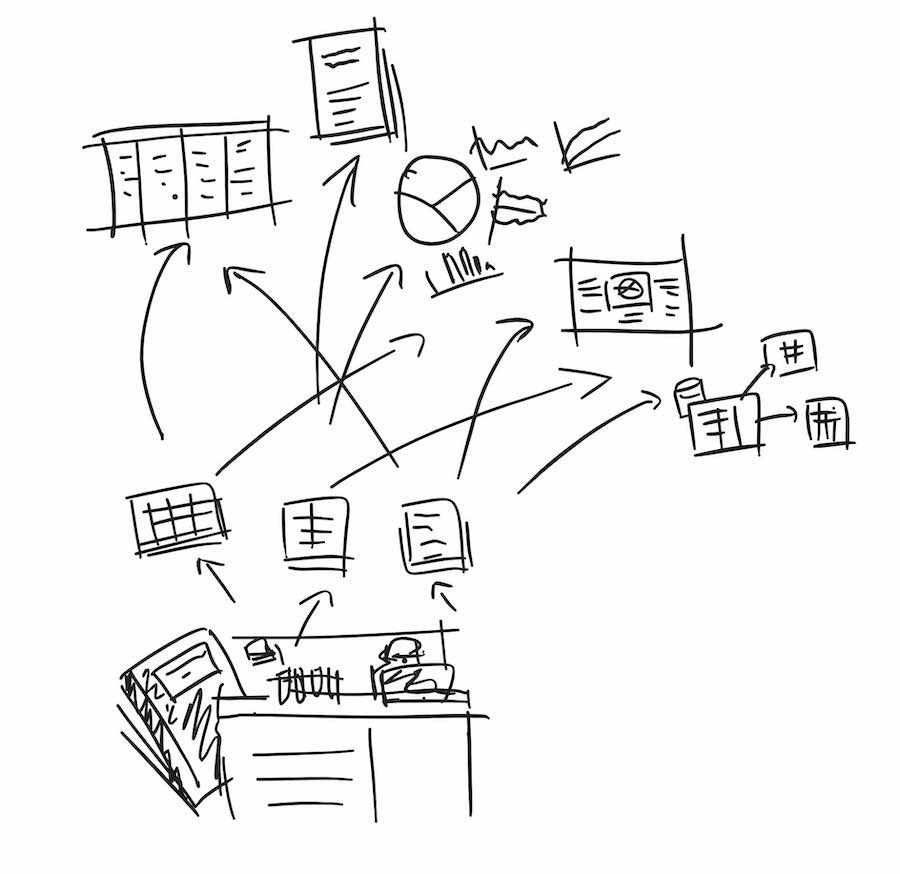
Fig 2. Use a combination of small SOPs, spreadsheets, or paper forms to collect smaller units of well-defined data from experiments. This takes little effort, but will save a lot of time in the future, as you can go straight to these forms when you fill out your databases and spreadsheets.
A way to start collecting structured data is to apply SOPs for smaller routine tasks like plaque assays. These SOPs will form the backbone for your data collection process, while also becoming building blocks for larger SOPs.
These SOPs should contain clear instructions for both the lab and for data collection, so anyone doing the work will not only do the work in the same way but also collect the data the same way. These data instructions could be anything from paper form or a Google Sheet, with clearly labeled data values and units to be collected at various time points.
The following is a minimal example chart for collecting phage-host interaction data with four popular methods, with some placeholder text. In a real example you’d collect other baseline information like the concentration of bacterial cells added, etc. On its own, it’s not remarkable, and is probably similar to what you already have in your lab.
| Phage-host |
Phage plaque assay: Spot dilution series |
Phage plaque assay: Full plate |
Phage plaque assay: Spot test |
Phage growth kinetics assay |
| Question the method is answering |
How many phages in this sample of phage X are active against bacteria Y? |
How many phages in this sample of phage X are active against bacteria Y? |
Is phage X active against bacteria Y? |
Is phage X active against bacteria Y? |
| Name of phage |
PhageX |
PhageX |
PhageX |
PhageX |
| Name of bacteria |
BacteriaY |
BacteriaY |
BacteriaY |
BacteriaY |
| Number of plaque forming units (pfu) |
25 pfu |
50 pfu |
- |
- |
| Volume of phage added (mL) |
10 µL |
10 µL |
10 µL |
10 µL |
| Dilution factor (1/100 or 10^-2) |
10^-4 |
10^-4 |
- |
- |
| Titre (PFU/mL) of phage X (calculated) |
2.5 x 10^6 PFU/mL |
5 x 10^6 PFU/mL |
- |
- |
| Plaque characteristics and morphology (plaque size, …) |
Average plaque size: 2 mm |
Average plaque size: 2 mm |
- |
- |
| Presence or absence of visible clearing on the agar plate (qualitative, yes/no) |
- |
- |
Yes |
- |
| Growth curve (OD600 of bacteria/hour) |
- |
- |
- |
OD600: 0.1, 0.2, 0.4, 0.8, 1.5, 2.9, 4.2, 5.3, 6.1, 6.5, 6.7, 6.8, 6.8 |
| Growth inhibition with phage |
- |
- |
- |
OD600 +phage: 0.1, 0.1, 0.2, 0.2, 0.3, 0.4, 0.5, 0.6, 0.6, 0.7, 0.8, 0.9 |
Aggregating entries over time
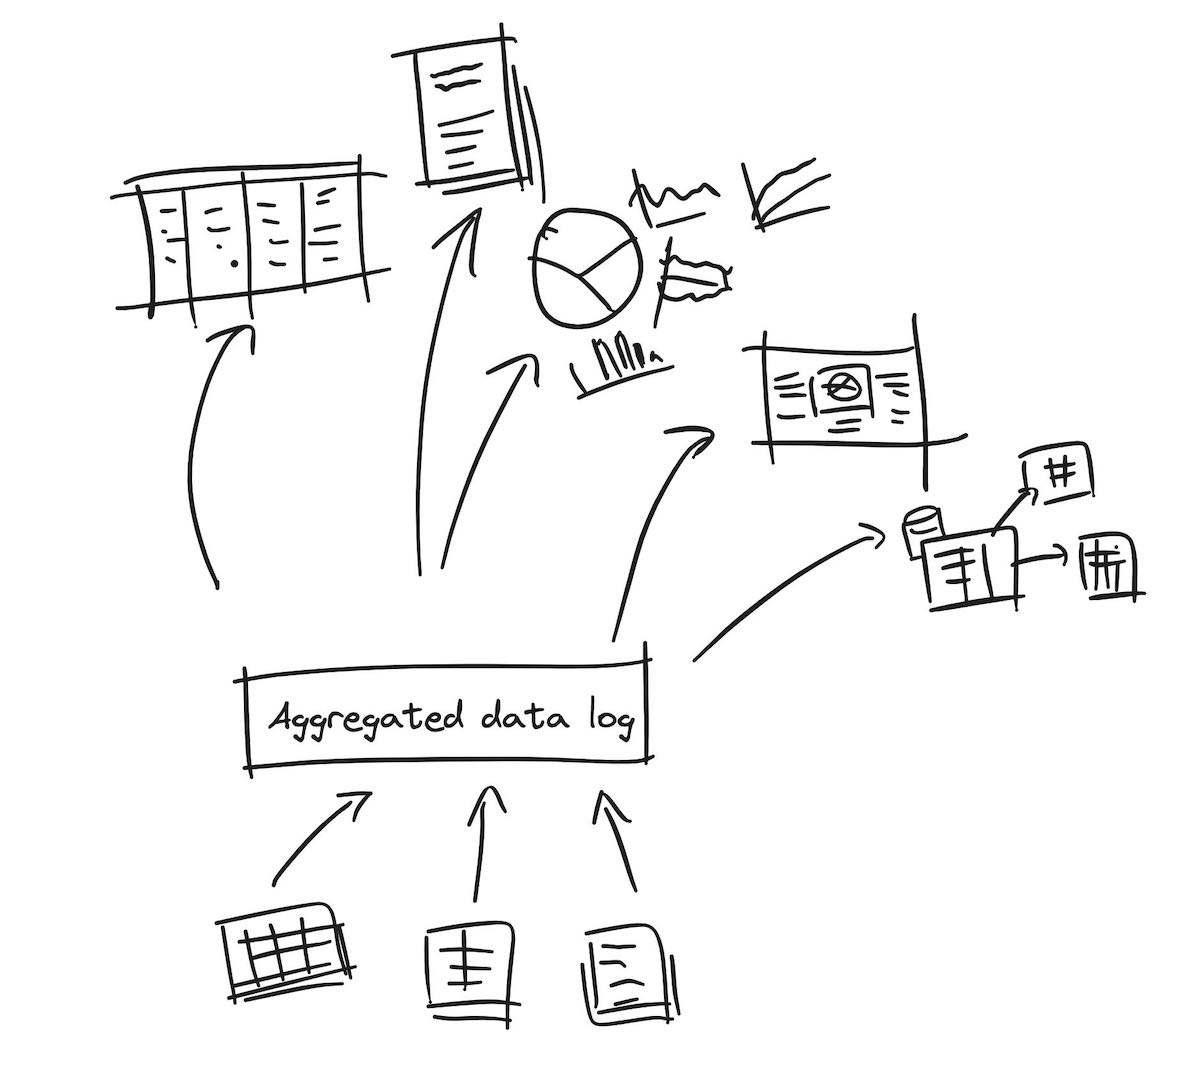
Fig 3. Ideally, we should be able to collect all our bite-sized protocol data into an aggregated “log” of all kinds of information. This log wouldn’t be a traditional relational database, but would support any kinds of information, including tabular data, relational databases, and even text files and images. This database would then ideally “extract and make sense of” the information within it, across its entire corpus of stored data.
When data is collected the same way over time, it can be aggregated to better describe what’s being measured.
For example, if we collect the temperature of Sydney at noon once a day, every day, for a year, we can use that data to describe Sydney’s weather, without explicitly calling it a “hot” or “cold” city. Similarly, if we collect plaque assay for phage across a collection of strain samples, we would use that data to describe the host range of a phage, rather than explicitly calling a phage an “E. coli phage.”
Industries like finance and tech call this type of data “event-based” or “append-only, log-based” data. This method could be used to describe the balance of a bank account: its total balance is just the aggregate of all the money that’s ever moved in or out of the account, at a specific point in time. By collecting data this way, previous values would never be erased. We would never replace yesterday’s bank balance by replacing the value; instead, we just add today’s new values. This way, we always have the latest balance, and we can still look up previous balances.
Contrast this with many spreadsheets and databases, which “updates the value in place” meaning the previous value was now gone. If you’ve ever changed your email in an app, or updated a phage’s host range by replacing the text in a spreadsheet, this is what’s happening.
Unfortunately, these kinds of data tools only really exist for software developers. For example, Linkedin has a way of aggregating every single interaction, 60 billion times a day. Developers also have plenty of database tools for like Splunk for data logs, TimescaleDB for time-based events, or schema-less databases like Couchdb or MongoDB, called “NoSQL” where each data record can have different columns. In each of these cases, it’s easy to store the data, but it takes a lot more effort to process and extract insights.
There aren’t really any user-friendly consumer tools like Google Sheets or Airtable for event or log-based data. Neither Airtable or Google sheets supports this out of the box. One could use Google Sheets and Google Forms to record experiment details, but this gets awkward over time — especially when many spreadsheets and forms are involved.
However, if we had a tool to aggregate our collected plaque assay data, we’d easily be able to generate a host range chart for PhageX, like the following example:
| Bacteria |
Volume of phage plated (mL) |
Dilution factor |
Number of plaque forming units (PFU) |
Titre (PFU/mL) |
Infectivity Level |
| BacteriaA |
0.01 |
10^-7 |
10 |
1 x 10^10 |
Strong |
| BacteriaB |
0.01 |
10^-8 |
2 |
2 x 10^9 |
Strong |
| BacteriaC |
0.01 |
10^-9 |
5 |
5 x 10^11 |
Strong |
| BacteriaD |
0.01 |
10^-3 |
3 |
3 x 10^5 |
Weak |
| BacteriaE |
0.01 |
10^-11 |
0 |
0 |
Not infective |
| BacteriaF |
0.01 |
10^-12 |
0 |
0 |
Not infective |
Entities, attributes, and values
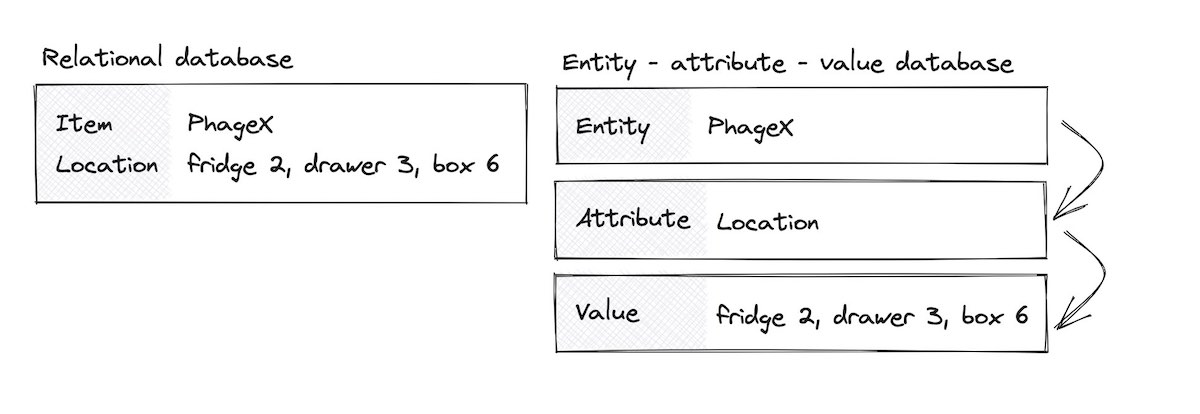
Fig 4. Whereas a traditional database setup would use one table to store the item name and location of a phage, an EAV setup would use three tables: one to track all the entities, another to track the attribute names, and a third to finally describe “for PhageX’s location attribute, the value is ‘fridge 2 …’”.
As a quick sidebar for other data engineers and bioinformaticians reading this post: there’s a another type of data model worth mentioning, called the “Entity–attribute–value model,” or EAV.
Designing schemas around biological data is difficult because there are sometimes hundreds of attributes one could use to describe an object, even something as “simple” as a phage. This would required hundreds of columns in a spreadsheet. Instead of using columns for each attribute, the EAV model only has three columns: the entity (“phageX”), an attribute describing the phage (”location”), and the value (”fridge 2, drawer 3, box 6”).
The benefit of such a system is that you don’t need to scroll hundreds of columns just to find where you need to enter a value. You just create a new row, type what attribute you’re trying to describe, and the value itself. The downside is that you can’t rely on the out-of-the-box spreadsheet or database interface anymore — you’ll need a tool to aggregate and display all this data properly.
As an experiment, I’ve created a toy library tracker EAV system in Airtable. This example describes books in an Entities table, descriptors like “author”, “category”, and “publisher” in an Attributes table, and tracks the values in two separate tables: one for core Characteristics like author name and another one for Events like check-ins, check-outs, stocking, and ratings. The Books Entities table shows both declared characteristics like description outside of the EAV model, as well as aggregated characteristics like average ratings, using rollup calculations.
This EAV library model works very well to track both events and attributes for the library items, but is incredibly difficult to use within Airtable. Though EAV is a great data model, I’d need to write another app for book search and checkins / checkouts — any kind of dashboard or insights tool will need to be built separately. Also note that I had to use a data storage pattern called “JSON objects” on some columns, which would require developers to create and edit the data.
One could also use the EAV model for biobank items, like phages — this is what I built for a Phage Australia Pseudomonas phage Pae7. This data is managed in Google Sheets, and aggregated and displayed on the website.
Originally the idea was that each phage would have its own Google sheet, but unfortunately, there are quite a few drawbacks to this method: Maintaining a Google Drive of hundreds of phages would be tedious, and we’d still run into the edit-in-place problem mentioned before. For Pae7, I built a template for data entry with Google Sheets, which works great for one phage, but became unscalable and unmaintainable for our hundreds of phages.
The missing event-based tool
So what are our options for collecting biology data? Our tool belt currently looks like:
- Apple Notes and Notion for spontaneous text entry
- Google Sheets for tabular data
- Airtable for relational and well-structured data
- Google Drive for miscellaneous files (up to a certain file size), or AWS S3 or Cloudflare R2 (for developers) to upload massive files
- ELNs like Benchling for strict SOP-based data collection
- Developer-centric log- and event-based databases and tools
Each tool is excellent on their own, but what we really want is a way to mix the data from each of those tools together, for ease of analysis and reporting. We want system that lets us easily find, aggregate, and reuse any piece of data across any of these tools whenever we have a research question. We also want the system to contextualize text automatically, so we don’t have to fill in forms, spreadsheets or databases in the first place. Finally, we also need all our data to be event- or log-based, so we can always go back and check the data at previous time points. Oh, and we probably also want our data to show up on a website or app, kind of like on Airbnb or Amazon.
Unfortunately we don’t have any tools that currently hit all of these checkboxes, so we’ll just have to build it ourselves!
In the last couple of years, there’s been a rise in phage groups wanting to collaborate and share both data and biobank specimens. To support this reality, we’ll need to develop a common way to characterize, save, and share phage data in the same way, through lab standards, SOPs and better data tooling.
For the next few posts I’ll go deeper into how to build such a system, and share demos and code along the way!
Further Reading