First of all, what is “data analytics”? Most companies use data analytics (sometimes called product analytics) to understand product usage and user habits. Companies usually have questions like: How popular are our blog posts (“How to design a phage data system,” the last post in this series, has a 45.9% open rate, meaning 600 people opened it, which is really good!)? What part of our site is confusing? What areas of the site are popular? This kind of information helps companies make decisions on what to improve, what to build, and what future posts to write.
Data-driven decisions
Many internet companies that sell a product or service (i.e. not us 🙃) intentionally design their sites for a certain behavior. Users visit their site, poke around, and if users like whatever they’re selling, they “convert” by signing up or adding to cart and checking out. This is a “product funnel”, and the “conversion rate” is the % of people who visit the website and successfully convert.
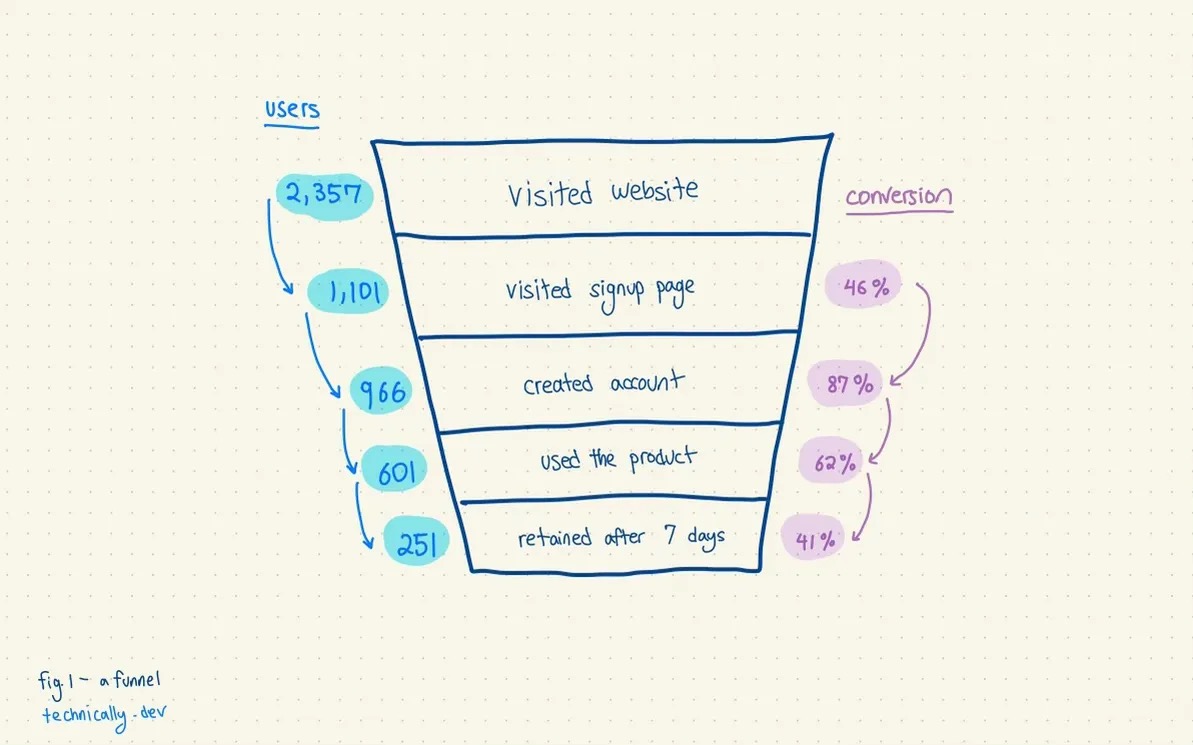
Fig. 1. A product funnel, with conversion rates. Credit: technically.dev https://technically.substack.com/p/how-do-product-analytics-work
Analytics is usually at the heart of many companies, as it tracks how sales is doing, and helps project either future success (e.g. “growth”) or in this economy, how much time until the clock runs out (e.g. revenue decline vs. how much cash is left in the bank). These numbers generally paint a picture of a company’s health, and executives often make decisions based on these numbers. For example, Netflix has been losing revenue and subscribers, and consequently they’ve cut their animation team, probably because of weak viewership and expensive production costs (despite making some of the best animation series in TV history).
What does data analytics look like? The data takes many shapes, from “raw data” to more “refined data”. Raw data for internet companies usually look like “events”: e.g. a list of “a user visited the “about page” at 3.05pm on October 11, 2022. More refined data, usually generated by a tool or with some code (e.g. using a SQL script to pull data from the database), could look like a list of users who visited product pages for that day, week, or month. Or a list of top 10 pages, broken down by days of the year. If the site sold costumes, it might show an uptick in Halloween-related site visits and activities in the weeks or month prior to Halloween.
Raw data will at some point end up as a series of charts and graphs in a presentation or Excel sheet somewhere, in front of a room of executives or board members. Charts, graphs, and presentations are a kind of data, but what I would consider higher-order data — data that communicates information, but can’t be manipulated with math.
In the “real world”, depending on the company and product, data usually comes in the form of events, database data (like user profiles and interactions), user-generated data like tweets and comments, images, videos, spreadsheets, devices, and a ton more formats.
Who participates in data analytics within an internet company?
- Executives make long-term decisions based on analytics: “where should we invest $ based on who buys (or uses) X?”
- Product managers make product decisions: “Who uses and don’t use X? Where do we spend our efforts?”
- Marketing and sales are measured against analytics: “Are sales increasing? Where are conversions coming from, e.g. Instagram ads, Facebook, or Google? What growth strategies are working?” “How much are we spending on ads per new user? (Also called ‘Customer Acquisition Cost’)”
Data teams and the tools behind them
Even though data is at the core of many companies, data roles have often been ill-defined. Some companies have data-focused teams like data science, data engineering, data analytics, while others have business intelligence, product analysts and marketing analysts teams.
Ultimately there’s two sides of a data team: (1) the ability to collect, build, and manage reliable data sets (Apple stores 8 exabytes — 8 million TB of data) and (2) the ability to translate all that data into stories to product teams and leadership, by understanding their needs. These are two different jobs. The first job needs engineering and statistics; the second needs an understanding of core products, business strategy, and leadership needs (but also statistics… everyone needs statistics).
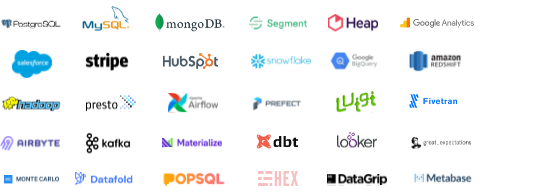
Fig. 2. This is like 1% of the data tools out there a company might use. We don’t really use any of them. Credit: technically.dev https://technically.dev/posts/what-your-data-team-is-using
Collecting data to tell cohesive stories that drive strategy is really hard. That’s why there are so many available data tools. Some of them are small (like Plausible, which we use for site analytics), and others are massive, like Segment (founded in 2012; acquired for $3.2B) and Snowflake (founded 2012; trading as $SNOW with a $50B market cap). These tools do all specialize in different parts of the data analytics pipeline, and many are used in conjunction. This makes up the “data analytics stack”. Plausible collects site analytics; Mailchimp, which we use as a newsletter sender, collects email open rates; Segment connects those events into data storage; dbt takes data from different sources and makes it interchangeable and comparable; Data Bricks, Snowflake, BigQuery, SQL, Amplitude, Hex, ObservableHQ, etc. are all help make sense of the data in different ways — python, R, and Excel are also used at this stage!
There’s also a small but notable difference between data analytics and data science, which could involve exploring data, looking for causality, patterns, and clues in the pursuit of new ideas; and let’s not forget ML engineering… This is how I understand the difference: data analytics uses data to drive organizational and strategic decisions, while data science uses data to gain more understanding of the world.
If you want a very deep dive on the technical stack, read this excellent deep dive on technically.dev!
Data analytics, biology R&D, and tools galore
Despite obvious differences, biology R&D has a few parallels with data analytics. Fundamentally, both fields deal with increasing amounts of data, a growing need to make sense of it, and an eagerness to turn data into decisions. And like data analytics, more tools are becoming available for biology R&D.
Of course, biology data looks different, from LIMS and ELN data, to images of plates, to to a mix of outputs created by devices like sequencing, TEM, optical density, OpenTrons/liquid handlers — the list goes on. But fundamentally the shape of the data looks the same: you have text files of various formats, spreadsheets and tables, images, and sometimes video and code.
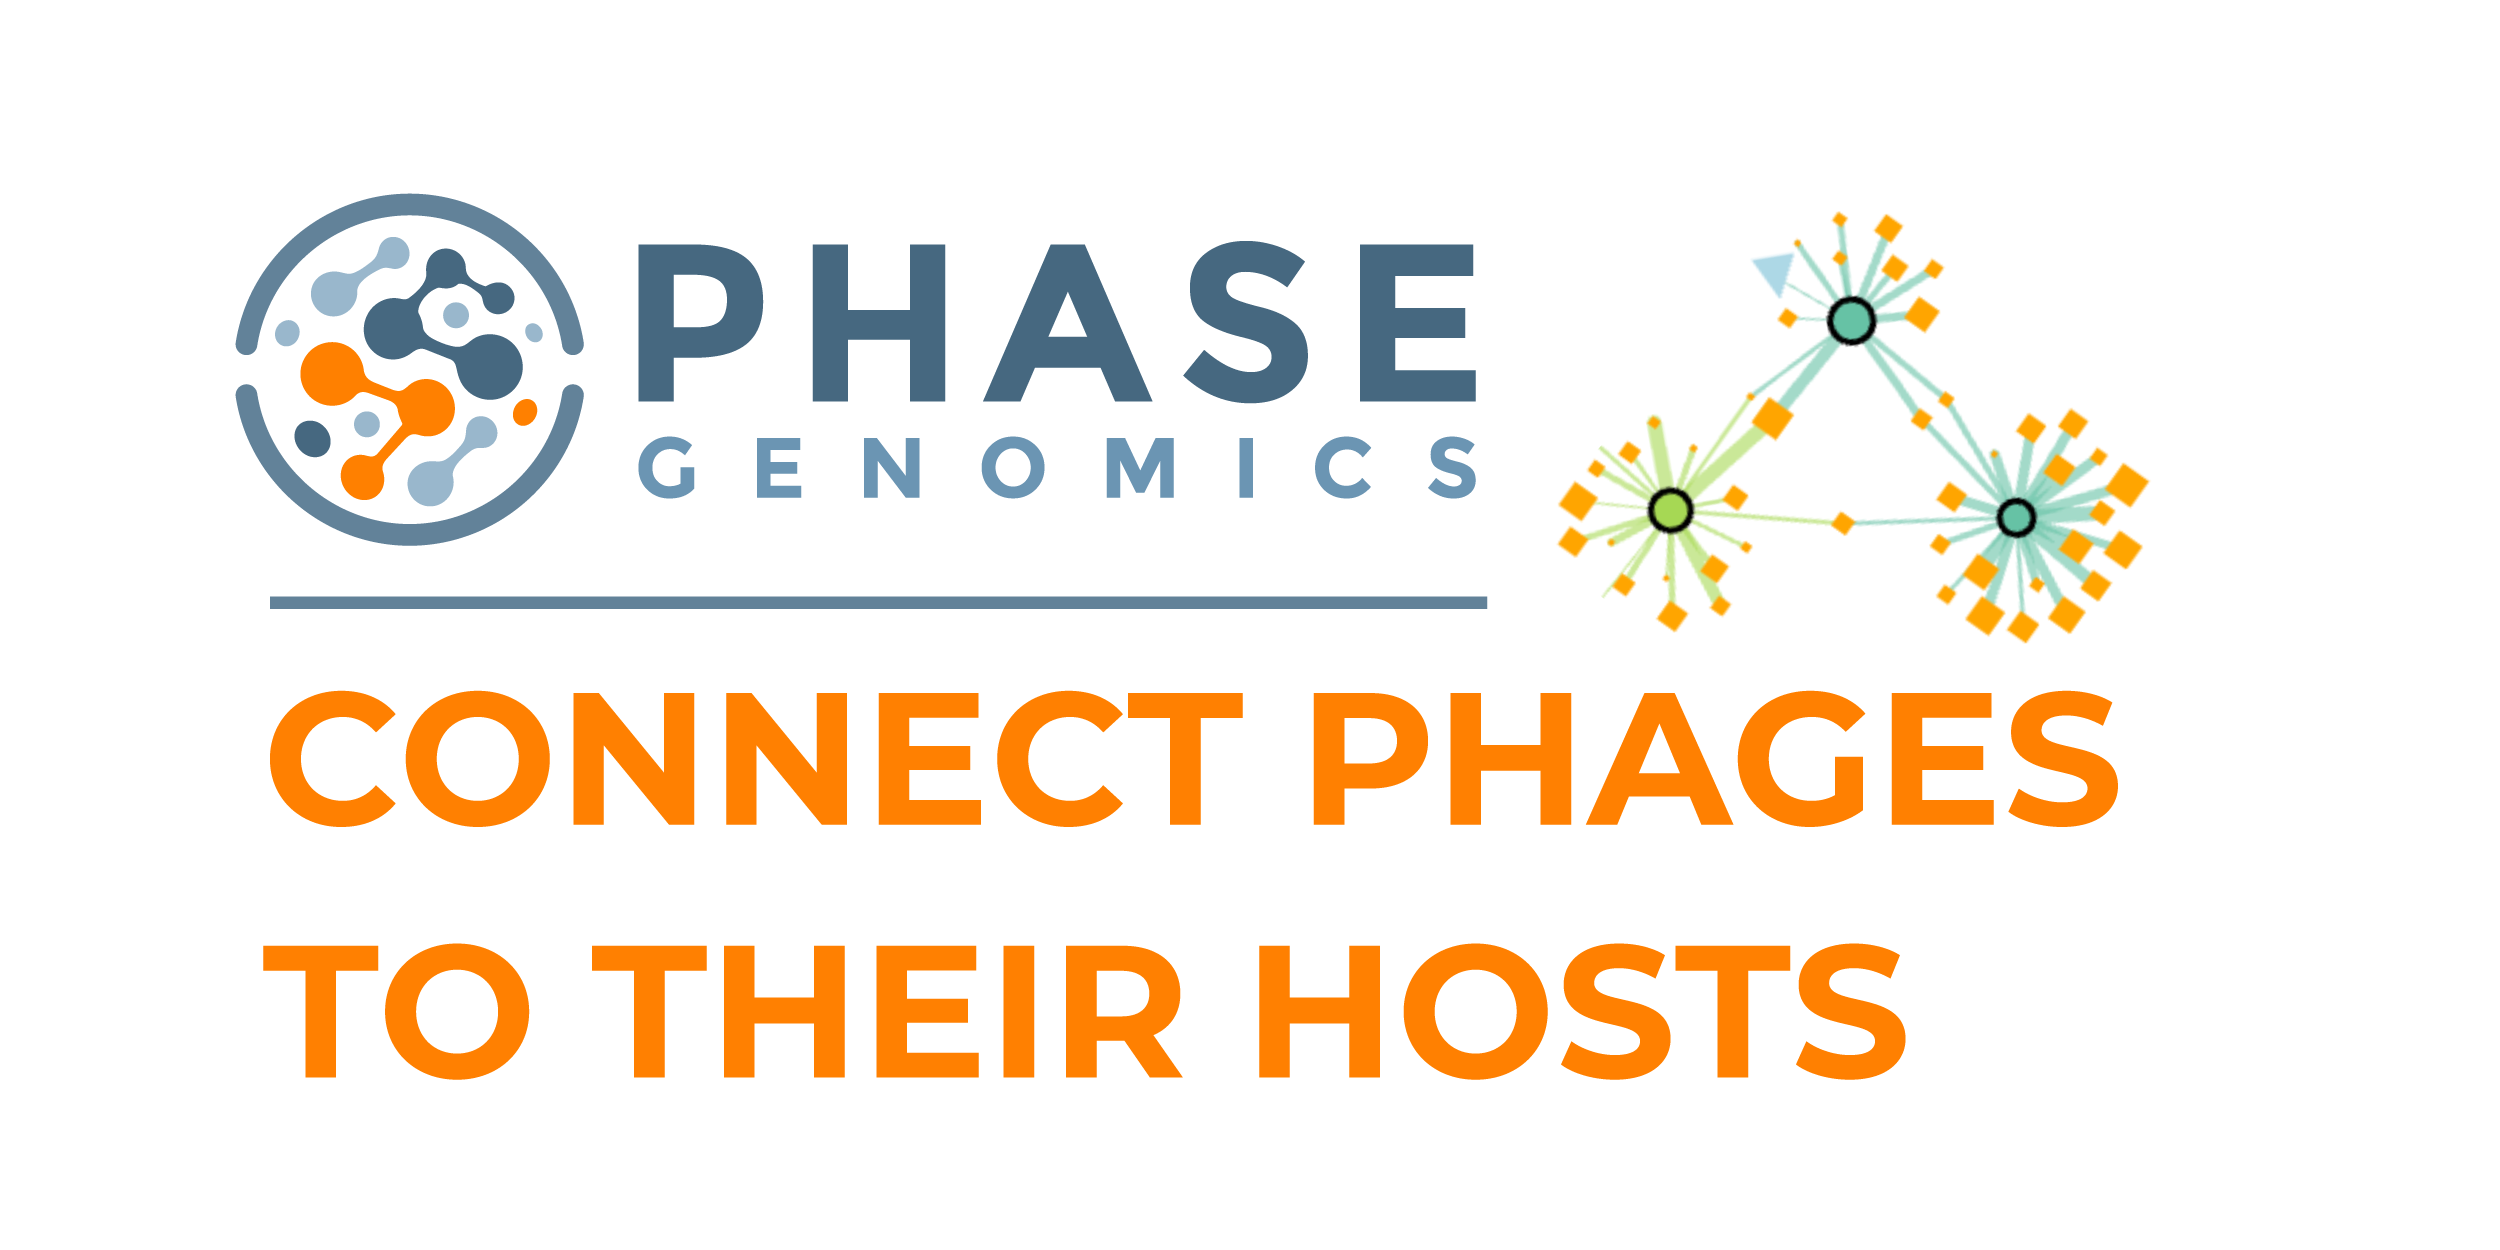
And like data analytics, the goal is to turn the data into insights and strategic decisions, like drug candidates for drug discovery. A whole slew of tools for analyzing and predicting data with machine learning are coming online, like Google’s Alphafold (and its excellent Protein Structure predictions database).
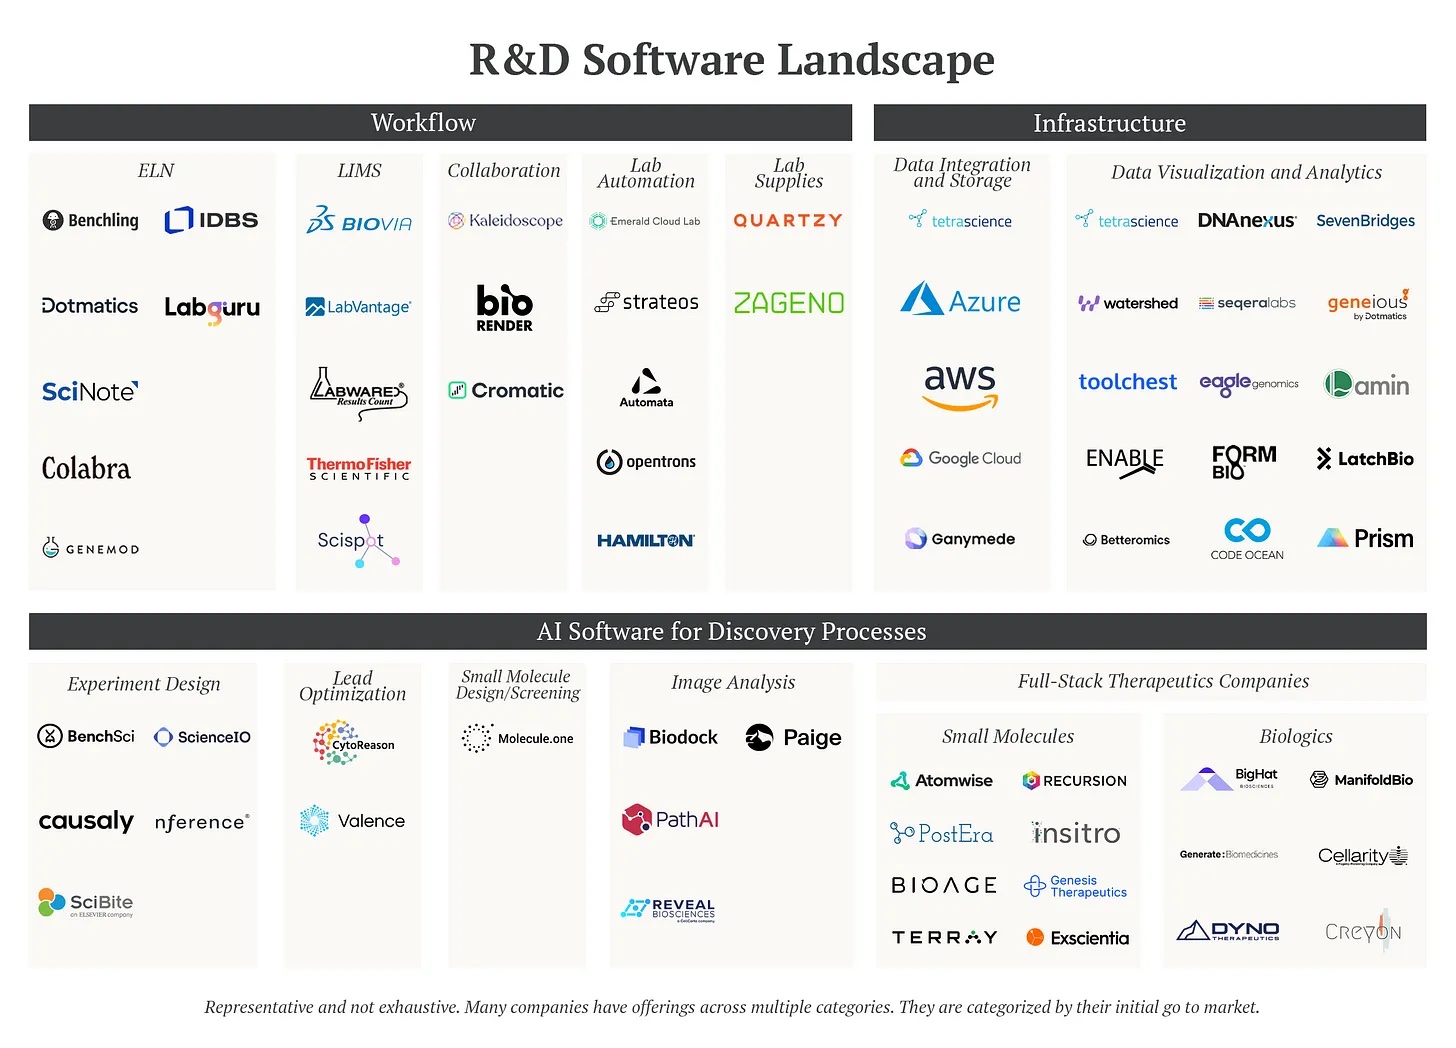
Fig. 3. A variety of software for the life sciences. This is just a small representation of all the tools out there. Credit: https://vitalsignshealth.substack.com/p/the-changing-world-of-life-sciences
The wave of bio R&D tools isn’t limited to drug discovery, though. Many data analytics and engineering tools are increasing being appropriated by biology. Tools like Nextflow (and MetaPhage) are using containerization tools like Docker to make it easier for bioinformaticians to run jobs. Non-bioinformatics data workflow languages like Luigi, Airflow, and dbt are increasingly use by bioinformaticians to move data around. Data storage tools (also called “buckets”, which I’ll get into in the future) like AWS S3 and the much more affordable Cloudflare R2 are making it easy to dump humongous amounts of raw data into “buckets” for your future self to worry about. And of course, there are a whole slew of tools designed specifically for biotech R&D, like ELNs like Benchling, LIMS like Quartzy, and visualization and analytics tools like LatchBio and classic fan favorites Prism and Geneious.
For the lab, the data stack can be broken down into a few key areas: experiment tracking (ELNs), lab operations tracking (LIMS), collaboration and documentation, lab automation, and lab supplies.
With the vast amount of data all of us will be generating, we’ll quickly outgrow our paper and pencil roots. At Phage Australia, we use Notion for all our process documentation and protocol development. We’re also experimenting with Airtable and Retool to prototype a lightweight phage-focused LIMS in order to collect more reliable data.
But let’s not forget: the goal of all these tools is to collect, clean, and shape data. In turn, this helps us create cohesive narratives and make sense of the world, which then in turn drive our further decisions.
Looking ahead: data analytics and phages
So what exactly does data analytics look like for phage therapy?
For Phage Australia, we want to use data analytics to help us lower the time it takes from receiving a request to delivering the therapeutic; ensure ongoing stability and safety in our phage preps; decrease our costs through choosing easier/faster/more reliable processes and automation tools, and lots more. Basically, to make us faster and safer. We’re still exploring all the different ways we’ll use data to guide our decisions, but we’ll be writing about all the phage-related decisions we’ll be making with the data we’re collecting.
Our data narratives are only as good as the data we collect. And our data is as good as the processes and tools we use. Like most labs, we’re transitioning from paper notebooks and spreadsheets to more replicable and auditable data systems.
Right now, we’re mainly focused on the data engineering question: how do we create a robust system that gives us reliable data? Because we’re a small team, we don’t want to spend too much time repeatedly aggregating and cleaning data. To achieve this, we’re using combining off-the-shelf products, building our tools, and using plenty of automation to create a phage data stack that fits our needs.
In the next issues in the Data Series, I’ll go deeper on what I think the data collection pipeline and analytics stack could look like for phage biology.
Readings