In the previous issue, Working with tabular data, we looked at some capabilities, pros, and cons of tabular data, and ran through a quick mini “not-a-tutorial” on using basic spreadsheet techniques. We discussed pivot tables, VLOOKUP, and saw how painful it can be to connect data from two different sheets.
Here’s a confession: the example I created was slightly contrived to end up in a situation that required us to look up information from two different tables, so I could have an excuse to go into databases. While spreadsheets are great for analyzing data, relational databases are great at collecting and creating relationships between data. Let’s jump into how that works!
What are databases again?
Recall that “records” are “pieces of information that describes a thing or event, like logs, transactions, and “objects” that consist of one or more pieces of information.
Databases are “spreadsheets” that store records. There are a few large exceptions: each column follows a strict schema. For example, the “Age” column could only store numbers, so any attempt at storing text will be rejected. Databases can have multiple tables, and each table stores a specific type of record.
Databases also allow one column to link to another table, called a relationship. For example, a People table could have a “Driver’s license” column that links to a table of driver’s licenses. This relationship is kind of like an “automatic VLOOKUP”; changes to one table automatically update in all related tables. (Recall that this might be a manual process with spreadsheets, when there’s an update). If a person’s name is changed, that change is reflected in the Driver’s license database.
Unlike VLOOKUPs, information is never duplicated between tables. The name of the person is always stored in the People table. The Driver’s license table merely “looks up” the name from the People column.
Starting with an Example
Let’s use the same example as “Working with tabular data”, where we wanted to break down the number of phage hosts by organization type.
We’ll be using Airtable to demonstrate the power of databases. We use Airtable for pretty much everything (from saving Capsid links to collecting Directory signups to organizing Evergreen!). Sign up to Airtable for free here (we get a referral!): https://airtable.com/invite/r/AHQ9XJCx
In the following example, I use Airtable to recreate the Excel sheet example from Working with Tabular Data.
Airtable example
The first thing I did was copy each tab (Organizations, PhageCollections) from the spreadsheet from the Working with tabular data issue (found here) to a new tab (called a table) in Airtable. I then connected the PhageCollections column in the Organizations tab by turning it into a linked field by clicking “Link to PhageCollections”. In the PhageCollections column, I did the same by connecting the “Name” field to the Organizations tab. By linking these tabs together, any updates to one table (e.g. if an organization changes name) will update the other linked table.
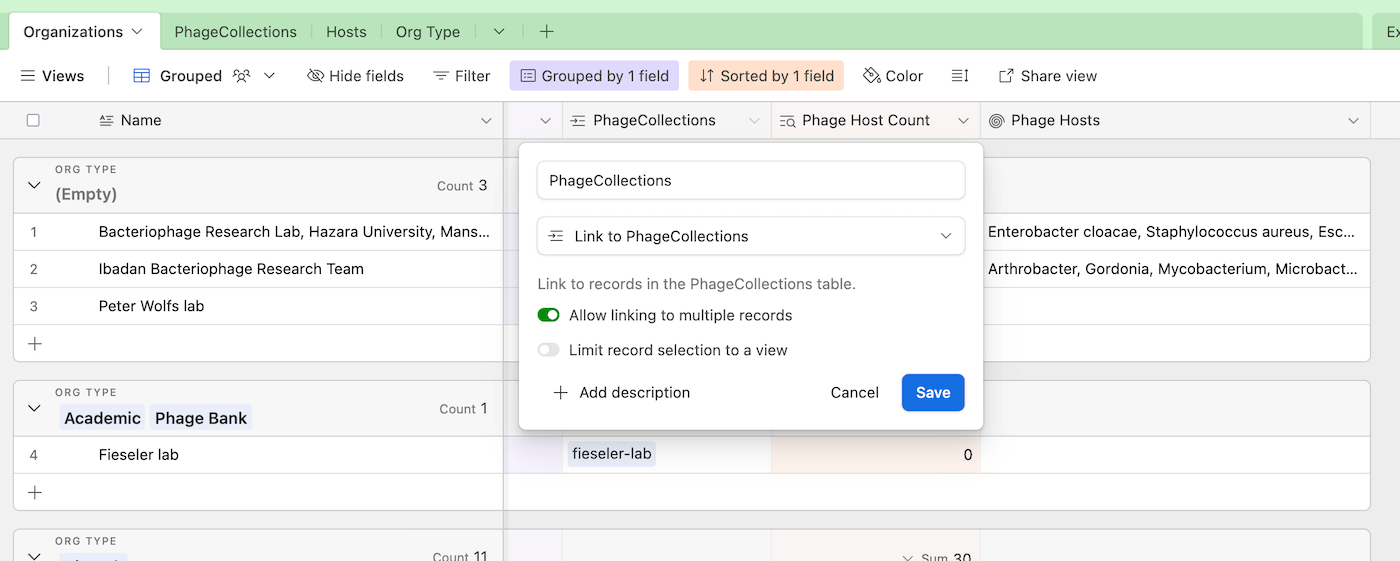
Fig 1. Here’s how the PhageCollections column in Organizations*** is used to connect to the PhageCollections table. In this example, the selected column from the Organizations table is linked to the “Collection ID” column of the PhageCollections table.
I then created two more tables, Hosts and Org Type, and connected the Org Type column from the Organizations table, and Hosts column from the PhageCollections table, as you can see below.
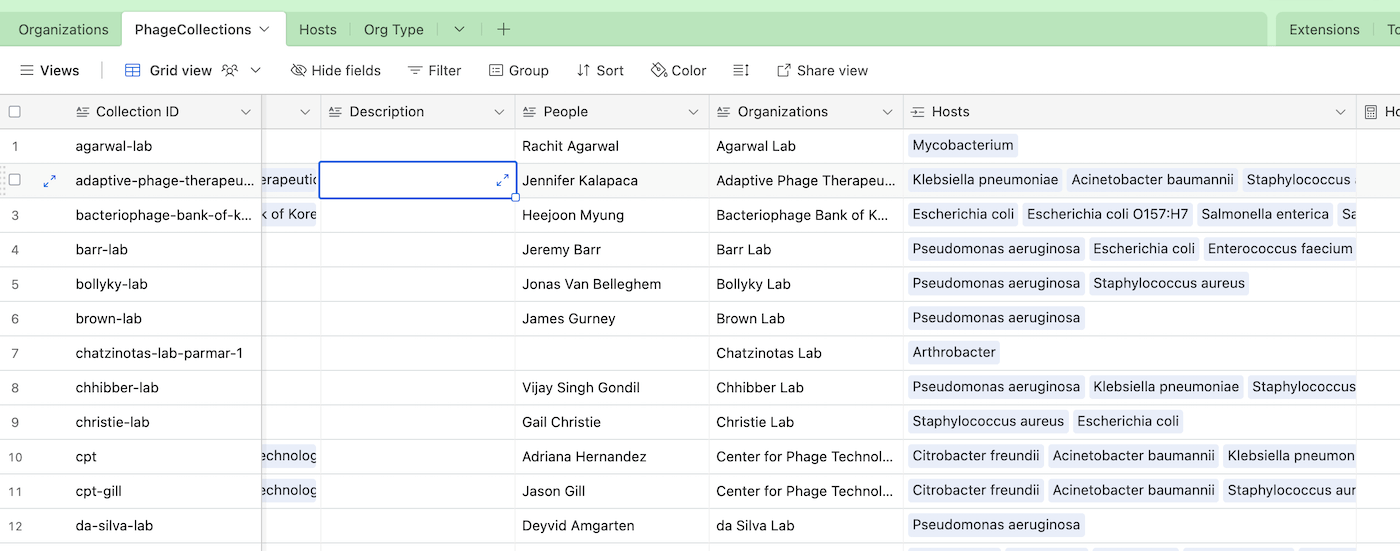
Fig 2. This example shows the PhageCollections table. See how the first column, Collection ID, has the same values as the PhageCollections column in the Organizations table in Fig 1. Also note that the column Hosts has been similarly connected to the Hosts table.
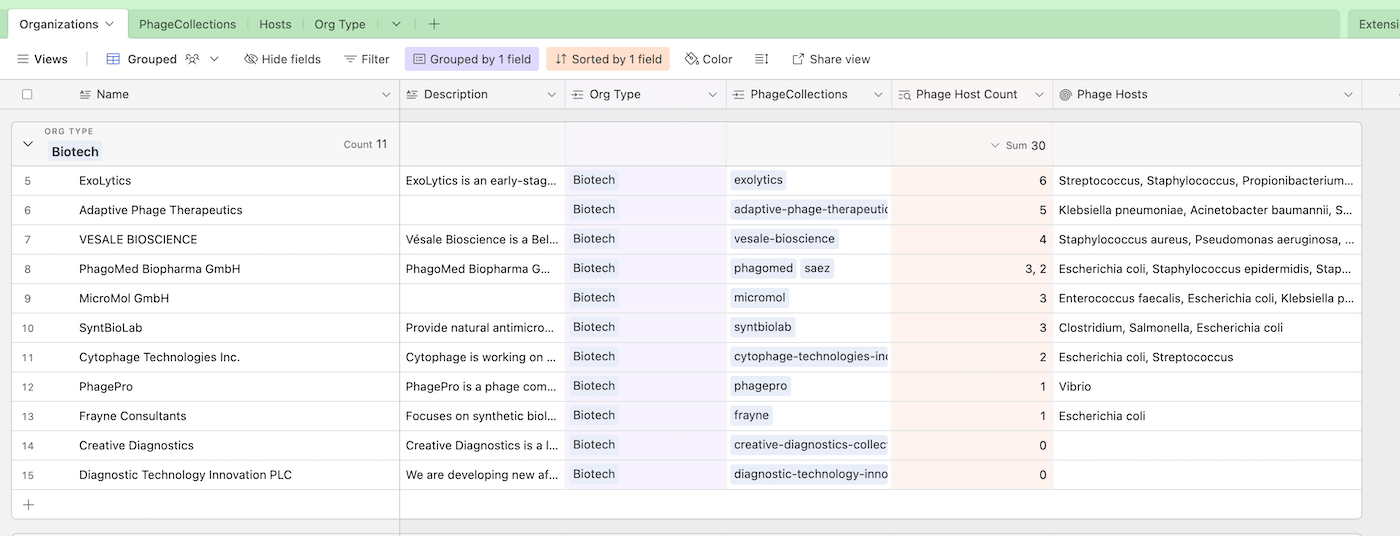
Fig 3. Here’s an example of connecting the Org Type column to Org Type table. Notice that by connecting tables in this way, we can count and display values from connected tabs, like Phage Hosts and Phage Host Count. This feature is called a rollup, and is a much simpler way to connect and display data compared to pivot tables. In this example, we’ve grouped each organization by type, and this screenshot shows a collection of Biotech organizations
By connecting the fields of one table to another table, we’re creating a relationship between the fields and the tables. In Fig. 2, we can see that PhageCollections has a field that shows all the Host items. In Fig. 3, we see the same hosts appear in the Phage Hosts column. We can do this because we’ve rolled up the Host field from PhageCollections, and we’re choosing to show them in the Organizations table. You can think of this as a “window” into the PhageCollections table. The best part is that if I add or remove a phage host (or change its name), the change propagates all the way to the Organizations**** table. As opposed to VLOOKUPs, Airtable relationships are “bidirectional,” which means that updating an organization will update the phage collection, and vice versa.
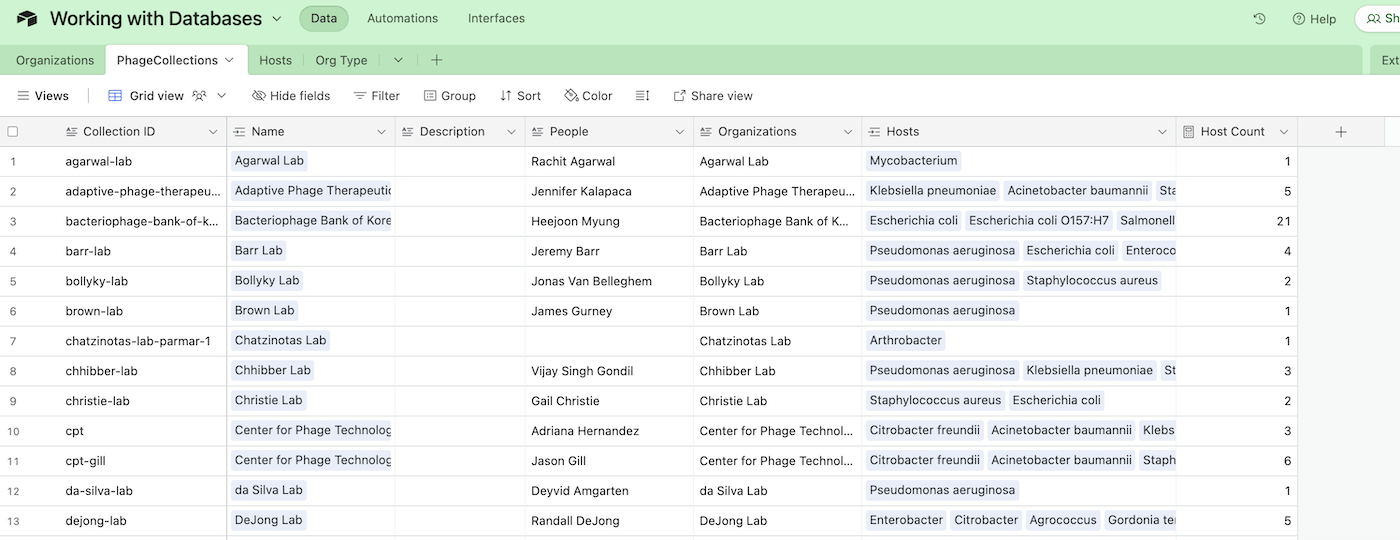
Fig. 4a. By turning the Hosts column into a linked field, we now treat each host as a separate item in the database. The “Host Count” column is a calculated value that automatically counts the number of Host items connected to each row. This gives us a quick glance to see how many hosts are connected to each row.
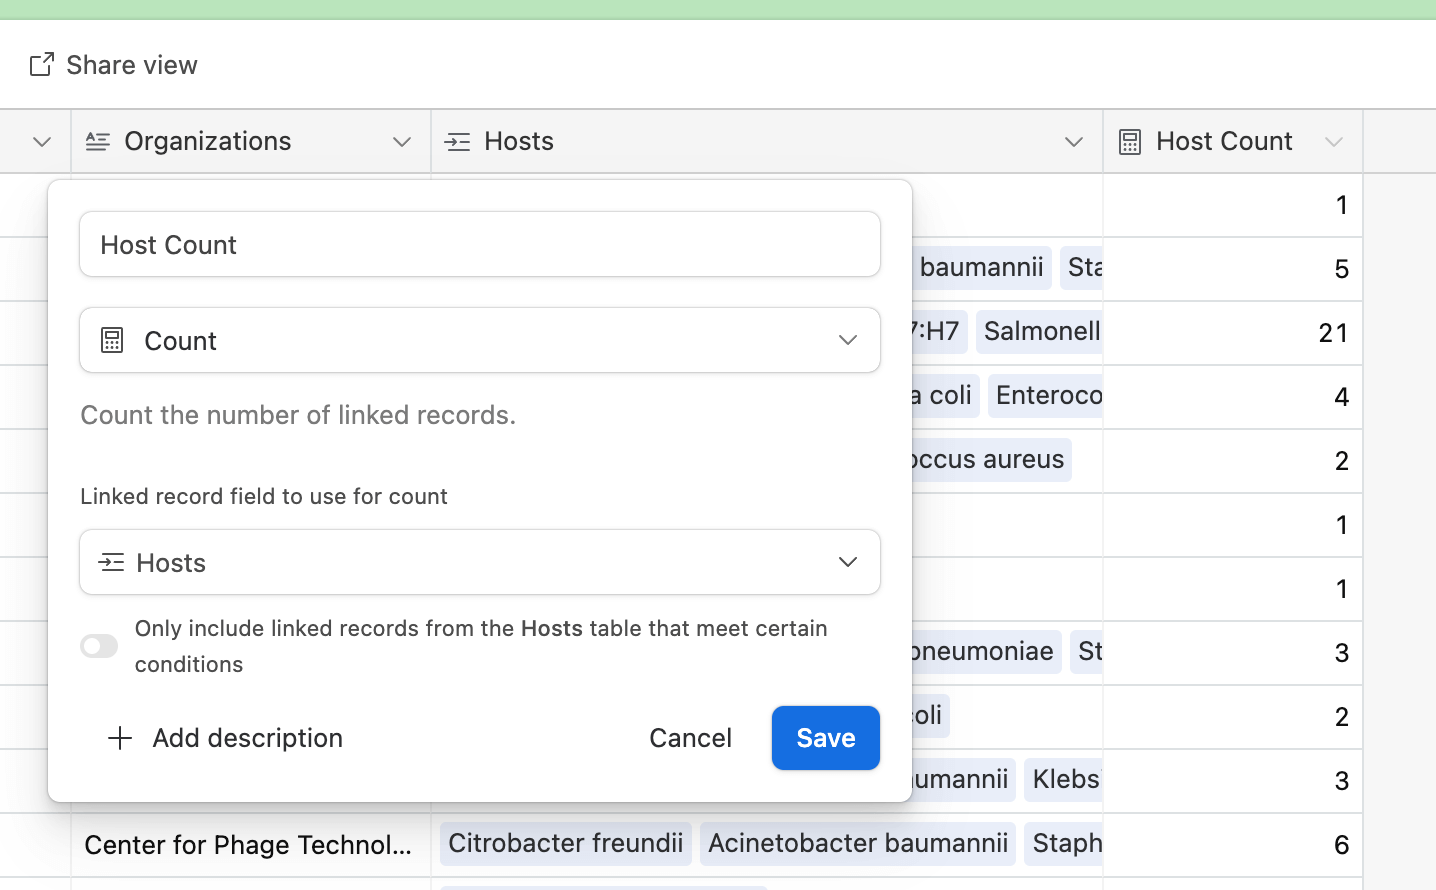
Fig. 4b. We can have special fields like Count, that can count the number of times Hosts occurs in a linked field. In this case, the Host Count table automatically counts how many items are in each Hosts field, but there are many other tools that could be used instead. For example, a Lookup tool could display one or more columns of the Host directly in the PhageCollections tab, without needing to switch to the Hosts table.
In the above screenshots, we’ve created a fairly complex relational database with just a few clicks, and we can get most of the information that took us a while to figure out with formulas and transformations in Excel. Isn’t that neat?
But wait a minute — from Fig. 3, we can see that in the Biotech category, ExoLytics has the most phage hosts… but that is incorrect. This is because of a peculiarity with Airtable’s rather than relational databases as a whole. In Airtable, an organization with only “Biotech” as an organization type is treated as an organization marked as “Biotech, CRMO, CRO, Phage Manufacturer”. This behavior is similar to the pivot table example from Excel, but unfortunately not something we need.
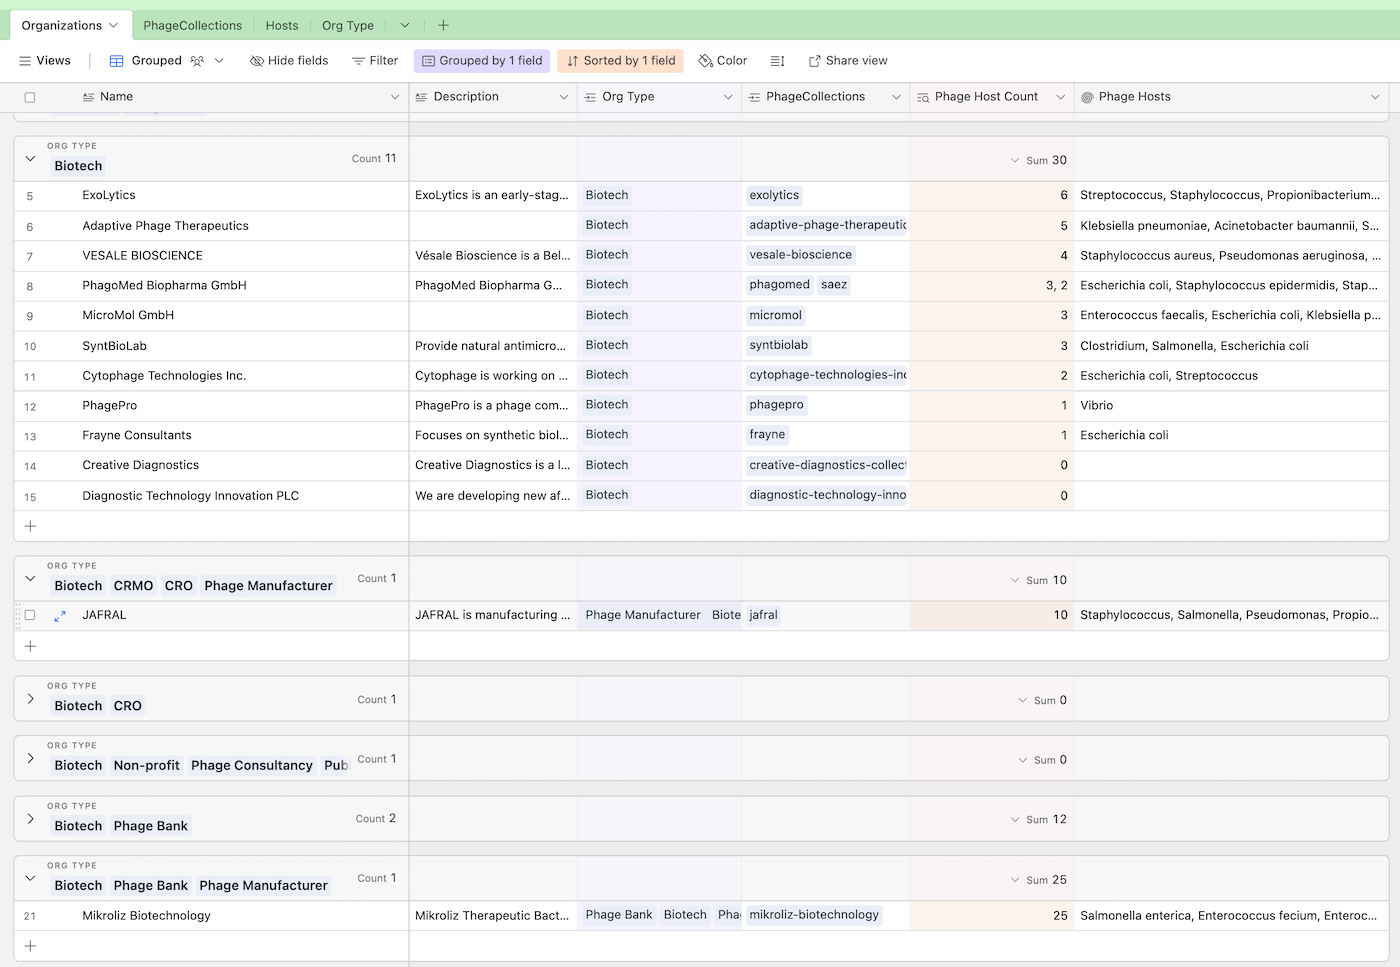
Fig 5a. This is a “Grouped view” of the Organization table, where we create groups based on organization types, like “Biotech”. Airtable treats the each grouped category separately (“Biotech” is different from “Biotech, Phage Bank”), which means organizations marked as Biotech might fall into different groups. This makes it really difficult to use a grouped view to look at and compare all organizations tagged “Biotech”
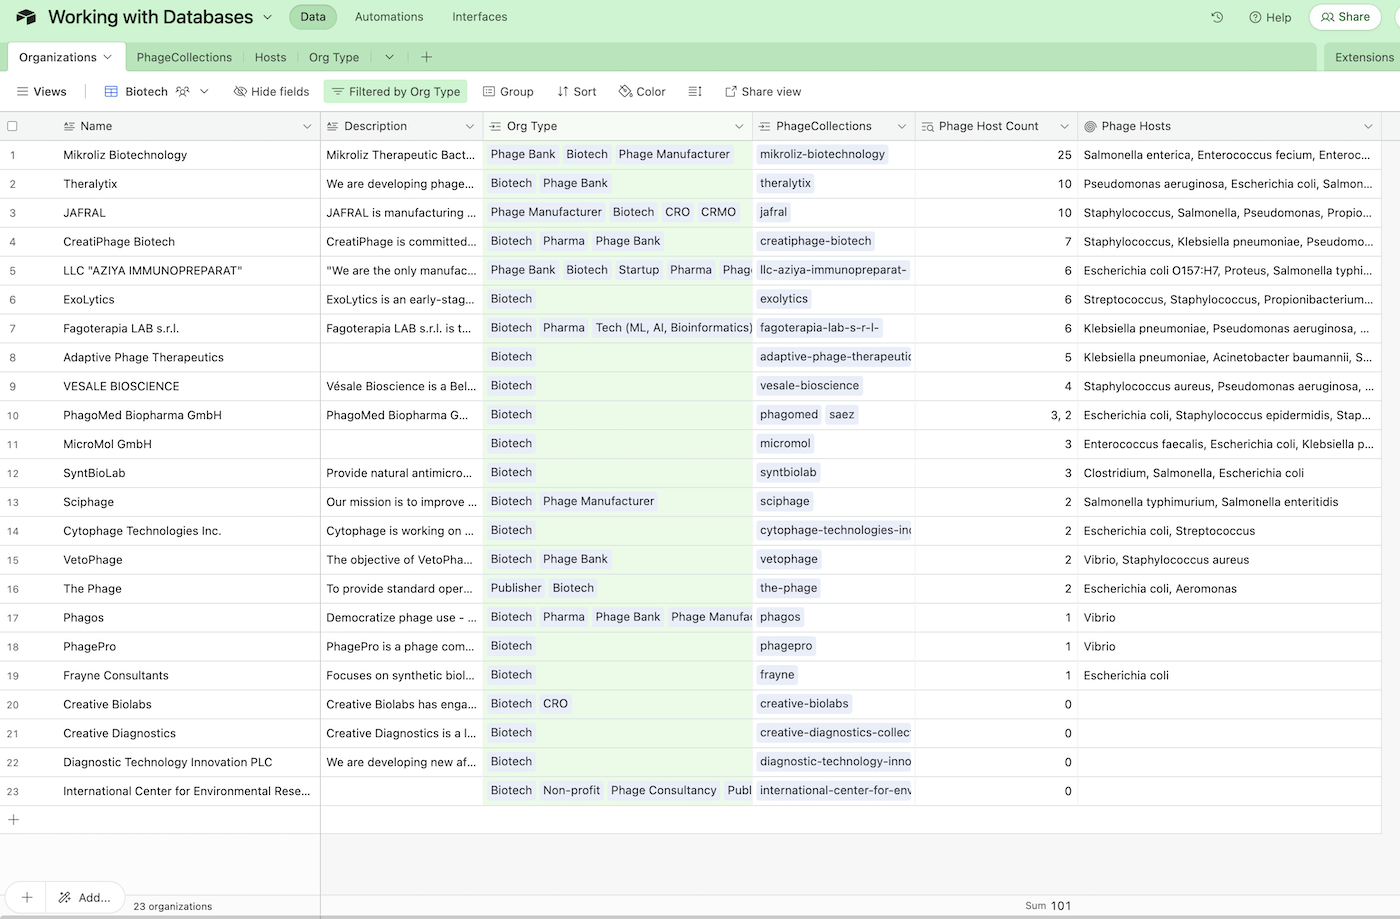
Fig 5b. To overcome this grouping limitation, we can instead filter the view by showing any items with an Org Type of Biotech. In this list, we can see that Mikroliz has the highest phage host count, at 25.
Airtable is a very powerful yet super simple database interface that lets you create tables, insert items, and connect columns and tables with relationships, like a relational database. Here’s the full Airtable to play around with. Because this is a public list, some features like formulas don’t appear here. Please duplicate this into your own Airtable account to play around with the data:
Here is the link to the Airtable. Please duplicate this into your own Airtable account to play around with the data. (Duplicate the database into your own account to be able to modify it): https://airtable.com/shrd5fppSieNAHONz
New to Airtable? Signup for a new Airtable account here (referral)
Recap: We looked at how to import an Excel spreadsheet into Airtable. We looked at how to insert the data into different tables, and then connect the tables via relationships called linked tables. We then looked at using tools like count to automatically tally the number of linked items in a row, and then used rollup to display that value elsewhere. We also played around with grouping the view by various types, discussed an Airtable design quirk, and created different views and used filters to get the real phage host counts.
Below is a 5-minute run-through of how I created the above Airtable base:
Watch the video here if the above doesn’t work: https://www.loom.com/share/9f980a00edc4438c86b6f72d3f1606cf
Why are databases useful?
As you can see, creating this Airtable database and crunching the numbers took very little time. Using linked records with rollups and calculations helps you quickly build a dashboard of data across many different sets of data. The best part is that we can treat each row of data as the source of truth — there is only one place to store a piece of information, and it informs every other place that needs to know about it. If a lab’s name changes, every other place that references that information is updated automatically.
When multiple tables are connected with relationships, you can easily create new “views” by combining columns from different tables, using features like rollups. These views can be really powerful, as each table could have dozens to hundreds of columns, and your view could calculate and select just the right columns needed for that view. This is one of many reasons websites store data in databases. Most tools and websites we use today are actually just user interfaces on top of databases. From LIMS, to Genbank, to Twitter and Airbnb… they’re all just a handful of pretty (sometimes not so pretty or user-friendly) interfaces that sit on top of databases.
The other neat thing about databases is that each column is “typed” and each table has a “schema of these types”. What this means is that you can set a column to be an integer, another column to be text, and another to be a predefined set of multiple choice options. If you try to set the integer column with text, well, it wouldn’t let you (typing letters wouldn’t do anything). A “schema” is a list that defines the type of each column in a table. This is really useful to have, because a quick glance at a schema can tell us what an item in the database could “look like”. This also prevents incorrect entries and typos!
How could databases be used for phage work?
You can easily use Airtable to track items in your lab and in your biobank (just create a Phage and a Host table and you’re off to a good start!). Using relationships, you can name columns after the relationship itself. A “Infects” column in a Phage table could link to a Hosts table, and every entry shows what the phage infects. You could have another column in the Phage table called “Parent” or “Child”, which would essentially create an ancestor/sibling relationship (this is called a “directed graph”).
There are lots of things you can try with a database! Airtable is the easiest to get started, but there are many out there, some with great user interfaces, some great for software developers (we won’t touch on those here).
Have a try at creating an Airtable for your lab — try tracking your phages, bacteria and inventory!
Some drawbacks of databases
While databases are powerful, they do come with a lot of drawbacks.
The power of schemas also mean they’re very annoying to update and edit: filling out forms is probably the worst part of using databases (soon you can use GPT for this!). It’s also a big hurdle to update many rows of data at the same time, and you end up having to do it repetitively, or writing scripts and code to do it.
Databases aren’t good tracking numbers like measurements and calculations. Databases also aren’t good for doing rapid data analysis. You can’t just copy and paste a bunch of numbers, run a few formulas to crunch some math, and throw it in a graph. This means you still need Excel around for that kind of work! (There are a few new types of database-like tools coming out that can address data analytics, like DuckDB or Datasette, but we’ll definitely not cover those advanced topics in this post). I always think that if you deal with measurement or time-based data (like growth curves or temperature over time, or stock price movements), use Excel. If you deal with lists of distinct items, use a database (Side note: there are time-based databases, but we’ll talk about those in a future issue) Generally, databases are terrible at telling narratives and stories — you’d need a separate tool like Jupyter Notebooks and Observable to do this job.
In addition to measurements, databases have a hard time storing things like images, videos, and documents like Excel or Word or PDF documents. Some databases like Airtable are able to attach files like PDFs, but aren’t able to “see” the content of the attached documents. For example, you can’t search Airtable for items with attachments that only mention lytic phages.
Tracking values over time
Finally, the largest drawback to both databases and spreadsheets, is that they’re both “change in place”. This means that every time you make an edit, you overwrite the previous value, and there’s no way to see what the last value was. For example, if a table of Library Books had “# of books” as column, the number would go up or down as books were borrowed and returned — but you’d never know how many books were borrowed that day. This is because by default, we don’t track the events of the books being borrowed or returned: only the current count of books.
In the next issue, we’ll go over how to set up a database to properly track events, as an event-driven database. Instead of tracking “# of books”, this database tracks “book events” that include “borrow” and “return” events. The aggregate of those events shows how many books have been borrowed and returned, and ultimately how many books are on the shelves. Such a setup has lots of benefits for the work of a phage lab. For example, we could collect phage/host data over time, and then aggregate the growth curve data to describe the host range (as opposed to subjectively declaring a host range). This is like instead of saying “Sydney is a hot weather city” and instead measuring the temperature every day, and letting the observer decide whether an average temperature of 22.6 °C is hot or not. Anyway, that’s a topic for next time — and a topic I’m really excited for… the entire reason for setting up the Data series is so I could start exploring event-driven data models with the few data nerds that are still reading. Can’t wait!