Welcome to part II of the ‘qPCR for phage therapy’ series!
In part I, I introduced qPCR as an underutilized way to track phages and bacteria during phage therapy. I went over the basic steps and why we do them, why we need qPCR standards and how to make them, and how I’m thinking about it all as I start to run qPCR on patient serum samples.
For part II, I wanted to go into what we should be looking for as we analyze our results. Did our primers work? Was our PCR reaction efficient? Is our standard curve useable? Assuming all these answers are yes, it’s finally time to take a look at our samples: how much phage / bacteria do we see in our patient serum samples?
Read part I here first if you missed it: qPCR as a window into phage therapy
⛔ Reminder: I am new to qPCR! My goal is to give a high-level overview of what I’m learning as I dive into this new technique. There are way more detailed/complete guides online if you’re ready to run qPCR yourself! Please only read the below as an intro/overview, and not as a complete tutorial.
Did our qPCR assay work?
So your qPCR run is complete, and you’ve got the data. So exciting! How many phages (or bacteria) were in your samples?
Not so fast. I like to hold off on checking my samples until I’ve had a good look at my standard curves, controls, and melt curves. If these don’t look right, we can’t interpret much about our samples anyway. A few things to look for:
Check PCR efficiency and limit of detection
You’ll want to look for several things. First, did your primers work? To get a sense, you’ll want to check out your standard curve (most likely, the software will plot it for you). Does it look nicely linear or not? As a reminder, the standard curve is made by graphing the Cq value for all of your standards (which, as we discussed in part I, would have come from decreasing, known concentrations of your starting phage or bacteria — whatever you’re trying to quantify).
When the Cq of your standards is graphed against the ‘starting quantity’ (ie. the known amount in PFU/mL that you added to your standards, on a log scale), the line should look linear, with a good (ie. close to 99%) r^2. The machine will also give you a PCR efficiency readout; you want 90-110% (anything lower or higher means your primers aren’t working efficiently).
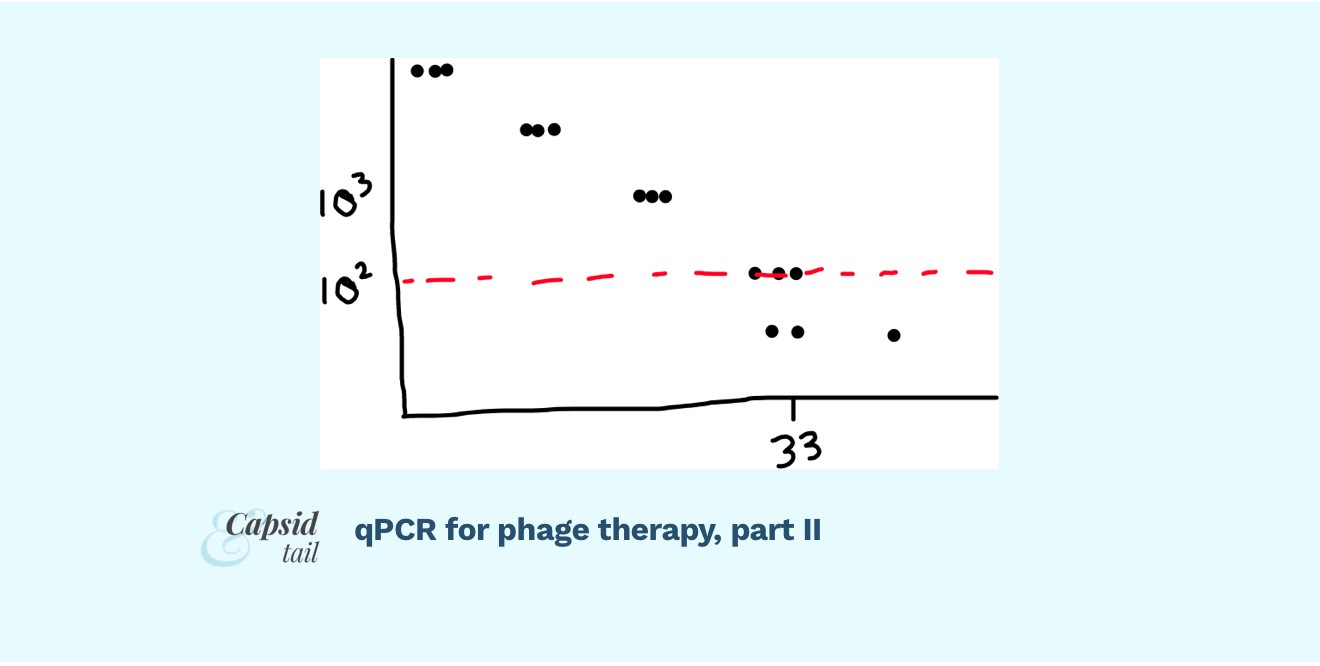
Your replicates should be clustering close together for most standards; though maybe some of the replicates start to diverge from each other at very low DNA concentrations (high Cq). This is to be expected. The point at which the relationship isn’t linear anymore is the point we can’t rely on our standard curve, and thus can’t use it to convert our sample Cq values into PFU/mL numbers.
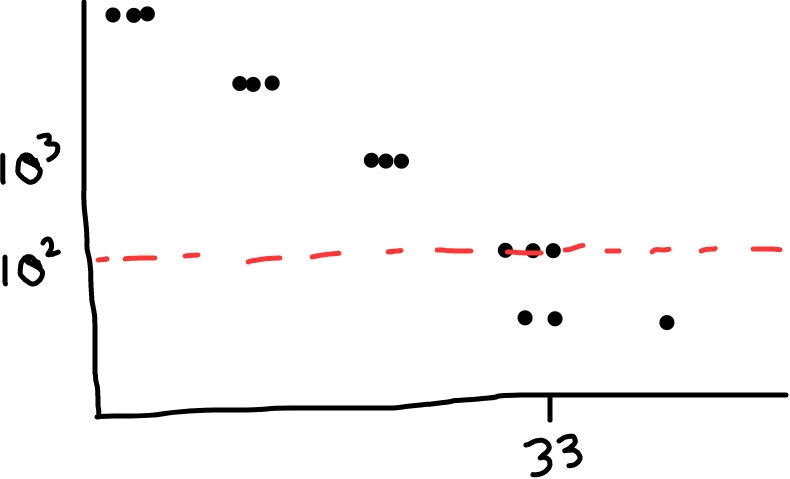
Fig 1: Example of a standard curve. It looks linear when you graph the log of PFU/mL vs. Cq (except at very high Cqs; the replicates start spreading more, the linear relationship breaks down; the curve becomes less reliable). The red dotted line shows where we might place the limit of detection, ie. the reliability limit for our assay. (In this example, it looks like readings under 10^2 PFU/mL are too unreliable, so we’d call that our limit of detection)
Check if your PCR was specific
You can also check the melt curve for each reaction, which helps tell you about quality of your reactions. Check for a nice, single peak (what you want), or for two peaks, or a peak with a shoulder (what you don’t want; suggests multiple products, likely primer dimers or nonspecific amplification).
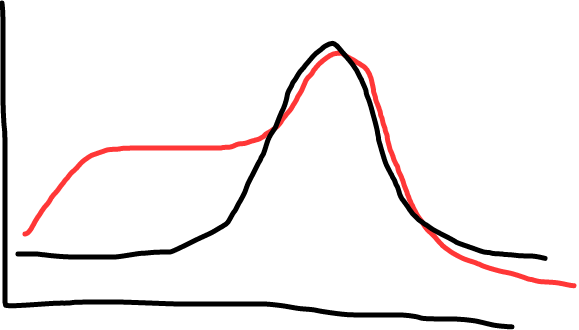
Fig 2: Black shows a single peak (good, this means a single product); red shows a shoulder (less ideal; shows there’s some non specific amplification, maybe primer dimers).
If any samples or standards show ugly melt curves, it could be a sign your PCR reaction isn’t working quite right. It could be the primers — maybe they need to be redesigned? It could be a bunch of other things too (there are many troubleshooting guides online).
Check that your negative controls are negative
Check your controls: are you getting amplification in your no-template control (NTC)? If so, something in your master mix (maybe the water you used?) might have a DNA contaminant. Any amplification in your crossover control? If so, you have one set of primers amplifying the wrong phage… you don’t want this, and should redesign your primers (maybe to amplify a different gene; something the other phage definitely doesn’t have, ideally).
Check that samples are within your standard curve range
Now check your samples. Are the Cq values within the range of your standards? (ie. not higher than the highest standard; not lower than the lowest).
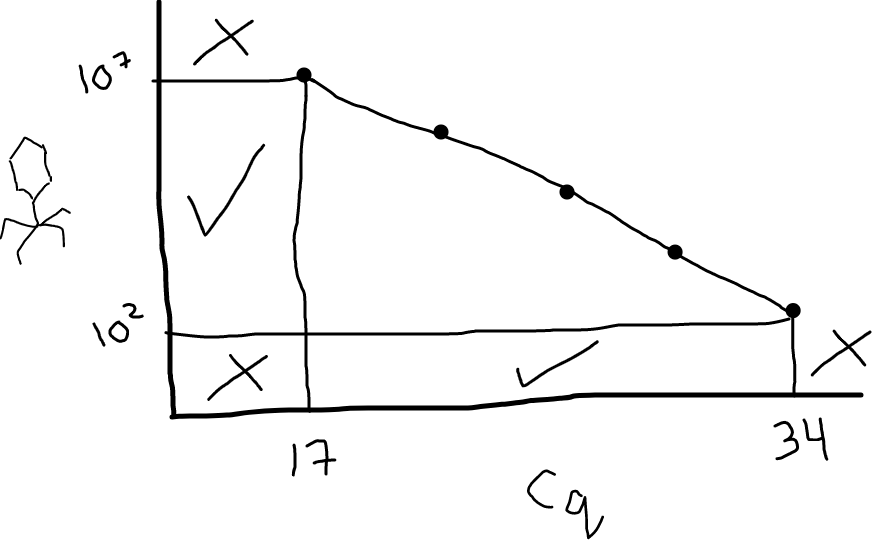
Fig 3: Your standard curve dictates the range of Cq values you can reliably convert to PFU/mL. In this illustration, Cq values between 17 and 34 are fine; anything below 17 or above 34 would be uninterpretable (you’d need to go make some additional standards). Looking on the y-axis, this means the range you can accurately measure in your samples (with these primers, for this target, under these conditions) is between 10^2 and 10^7 PFU/mL.
Samples (finally!): how much phage (or bacteria) did we count?
Assuming you filled in the ‘known quantities’ for your standards, the software you’re using (that comes with the qPCR machine) will calculate the predicted PFU/mL (or CFU/mL) that your samples have in them. Yay! These are the values you want. You can graph them and do stats on them to your heart’s content.
⛔ Caveat: qPCR detects DNA copies, not actual PFU/mL or CFU/mL; but your standards were set at a certain PFU/mL or CFU/mL (and depending on how many dead/inactive ones there were in there, this number may or may not reflect the number of copies of DNA in that organism). For simplicity, you may want to assume 1 copy = 1 PFU, and swap out the units (ie. report ‘copy number per mL’ instead of PFU/mL). This is a larger topic to explore for another day.
Now it’s finally time to think about the data and what it might mean biologically. Did your phage go up higher after an hour in the body? Did it drop quickly back to baseline after a day? There’s so much you can glean; of course depending on when you were able to get samples.
In a future post, if there’s interest, I’m happy to get into how to actually turn Cq values into PFU/mL (or CFU)/mL yourself, along with a spreadsheet tutorial, so you can understand what the software is doing, rather than being reliant on it. Let me know if that’s something you’d be interested in seeing!
Admire your handiwork
Great work! You’ve done qPCR. Do this for every organism (phage or bacteria) you want to detect in your samples. Do this over time during phage therapy, and track what’s going on in the patient’s body (obviously this needs to be part of an ethics-approved trial since it involves human subjects). Or just use it count phages/bacteria copies in any sample you come across. Whatever you want!
Of course, don’t forget that even if your qPCR is perfect, with all the right controls and standards, it is never going to give you a full picture of what’s going on biologically. It’s a method of counting DNA copies, and it doesn’t distinguish between living vs. dead phages/bacteria. That said, I still think it’s a helpful way to add colour to what’s going on with the phage/host battles we’re facilitating, from the test tube to the patient.
The beauty of a well-established method
A reminder that even though this method is rarely done in the phage therapy field, it’s super common in the world in general! This means there’s a LOT more you can learn about qPCR; lots of detailed troubleshooting and experimental design guides online. I am barely scratching the surface here, and am certainly still learning myself. But I hope this has given you a window into roughly what qPCR is about, how it might be applied to phage-related questions, and helped you get a sense of the process before you get lost in too many rabbit holes and get too overwhelmed to start.
Further reading
- BiteSizeBio qPCR guide
- Taylor, S. C. et al (2019). The ultimate qPCR experiment: producing publication quality, reproducible data the first time. Trends in Biotechnology, 37(7), 761-774.
- Paper using qPCR to follow a phage (and Pseudomonas target) in a patient’s serum samples during phage therapy (I’ve been following the methods used here): Khatami, A. et al. (2021). Bacterial lysis, autophagy and innate immune responses during adjunctive phage therapy in a child. EMBO Molecular Medicine, 13(9), e13936.
- STAMP Study, which includes qPCR to track phages and bacteria in serum: Khatami, A. et al. (2022). Standardised treatment and monitoring protocol to assess safety and tolerability of bacteriophage therapy for adult and paediatric patients (STAMP study): protocol for an open-label, single-arm trial. BMJ open, 12(12), e065401.
- Paper doing qPCR on 5 phages and comparing with plaque assays: Duyvejonck, H. et al. (2019). Development of a qPCR platform for quantification of the five bacteriophages within bacteriophage cocktail 2 (BFC2). Scientific reports, 9(1), 13893.
- Paper using qPCR to follow a bunch of phages in different cocktails vitro: Wandro, S. et al. (2022). Phage Cocktails Constrain the Growth of Enterococcus. Msystems, 7(4), e00019-22.